search the site


AMSA Annual PSC Report 2025: 237 ships were detained in total

Australian Maritime Safety Authority (AMSA) has issued its Annual Port State Control (PSC) report for 2025, revealing deficiencies related to the International Safety Management (ISM) category were the most prevalent once again, like 2024.
According to the data, PSC inspections increased by 22.26% to 2,768 initial inspections in 2025 (from 2,264 in 2024). The detention rate fell to 4.8% (from 5.9%), below the 10-year average of 5.7%, suggesting improved compliance among foreign-flagged vessels. Deficiencies per inspection remained broadly stable at 2.73 (up from 2.63), still above the long-term average. Overall, the data indicates improved targeting effectiveness and better compliance outcomes.
| 2024-25 Port State Control arrivals and inspections | ||||||
| PSC category | 2024 | 2025 | Difference | % change | ||
| Total arrivals | 28,650 | 28,639 | -11 | -0.04% | ||
| Individual ships which made those arrivals | 6,061 | 6,153 | 92 | 1.52% | ||
| Ships eligible for PSC inspection | 5,884 | 5,976 | 92 | 1.56% | ||
| Inspections | 2,264 | 2,768 | 504 | 22.26% | ||
| Inspections by individual ships | 2,002 | 2,507 | 505 | 25.22% | ||
| Inspection rate of eligible ships | 34% | 42% | 8% | 23.30% | ||
| Deficiencies | 5,960 | 7,561 | 1601 | 26.86% | ||
| Detainable deficiencies | 185 | 187 | 2 | 1.08% | ||
| Rate of deficiencies per inspection | 2.63 | 2.73 | 0.1 | 3.76% | ||
| Detentions | 133 | 133 | 0 | 0 | ||
| Detentions as a % of inspections | 5.9% | 4.8% | -1.1% | -18.21% | ||
2025 Deficiencies by category and ship type
By ship type, bulk carriers were by far the dominant source of deficiencies, accounting for 4,563 cases, which is substantially higher than any other category. However, this is not surprising given bulk carriers accounted for 51.8% of ship arrivals and 58% of all inspections. Overall, the data shows a clear concentration of deficiencies in bulk carriers and a broad increase across categories year-on-year, alongside a modest rise in deficiency rates.
| Ship Type | Structural / Equipment | Operational | Human Factor | ISM | MLC | Total Deficiencies |
| Bulk carrier | 2,445 | 507 | 658 | 234 | 719 | 4,563 |
| Chemical tanker | 19 | 2 | 3 | 0 | 0 | 24 |
| Combination carrier | 12 | 4 | 3 | 0 | 4 | 23 |
| Container ship | 582 | 159 | 144 | 57 | 166 | 1,108 |
| Gas carrier | 28 | 3 | 12 | 4 | 12 | 59 |
| Gas carrier / NLS Tanker | 0 | 0 | 2 | 0 | 0 | 2 |
| General cargo / multipurpose | 329 | 66 | 77 | 30 | 93 | 595 |
| Heavy load carrier | 15 | 2 | 2 | 0 | 1 | 20 |
| Livestock carrier | 42 | 5 | 6 | 1 | 8 | 62 |
| NLS tanker | 14 | 3 | 2 | 1 | 1 | 21 |
| Offshore service vessel | 26 | 7 | 10 | 1 | 5 | 49 |
| Oil tanker | 117 | 27 | 24 | 7 | 27 | 202 |
| Oil tanker / chemical tanker | 109 | 23 | 31 | 9 | 36 | 208 |
| Oil tanker / NLS tanker | 4 | 0 | 1 | 0 | 3 | 8 |
| Other types of ship | 44 | 43 | 13 | 8 | 15 | 123 |
| Passenger ship | 50 | 8 | 12 | 1 | 7 | 78 |
| Refrigerated cargo vessel | 2 | 2 | 1 | 0 | 2 | 7 |
| Ro-ro cargo ship | 4 | 0 | 2 | 0 | 1 | 7 |
| Special purpose ship | 9 | 3 | 1 | 1 | 1 | 15 |
| Tugboat | 23 | 11 | 13 | 0 | 3 | 50 |
| Vehicle carrier | 103 | 26 | 44 | 8 | 45 | 226 |
| Wood-chip carrier | 49 | 13 | 10 | 3 | 36 | 111 |
| 2025 Total | 4,029 | 914 | 1,071 | 365 | 1,185 | 7,561 |
| 2025 Deficiency Rates | 1.5 | 0.3 | 0.4 | 0.1 | 0.4 | 2.7 |
| 2024 Total | 3,210 | 782 | 741 | 293 | 934 | 5,960 |
| 2024 Deficiency Rates | 1.42 | 0.35 | 0.33 | 0.13 | 0.41 | 2.63 |
Detainable deficiencies by type (2024–2025)
The deficiencies per PSC inspection remained consistent in 2025 with a deficiency rate of 2.73 compared to 2.63 in 2024. This rate remained higher than the 10-year rolling average of 2.29 deficiencies per inspection. This increase reflects a higher proportion of inspections being directed toward high-risk ships, which typically present more complex and numerous deficiencies.
| Deficiency Type | 2024 Count | 2024 Share | 2025 Count | 2025 Share | Trend |
| ISM | 51 | 27.57% | 50 | 26.7% | ↓ |
| Water / weather-tight conditions | 24 | 12.97% | 32 | 17.1% | ↑ |
| Lifesaving appliances | 21 | 11.35% | 27 | 14.1% | ↑ |
| Fire safety | 28 | 15.14% | 25 | 13.4% | ↓ |
| Emergency systems | 14 | 7.57% | 14 | 7.5% | ↓ |
| Pollution prevention – Annex I | 15 | 8.11% | 12 | 6.4% | ↓ |
| Labour conditions | 10 | 5.41% | 11 | 5.9% | ↑ |
| Other | 5 | 2.7% | 5 | 2.7% | – |
| Propulsion and auxiliary machinery | 2 | 1.08% | 3 | 1.6% | ↑ |
| Safety of navigation | 0 | 0.00% | 3 | 1.6% | ↑ |
| Cargo operations including equipment | 0 | 0.00% | 2 | 1.1% | ↑ |
| Certificates and documentation | 8 | 4.32% | 1 | 0.5% | ↓ |
| Pollution prevention – Annex IV | 2 | 1.08% | 1 | 0.5% | ↓ |
| Radio communications | 3 | 1.62% | 1 | 0.5% | ↓ |
Domestic commercial vessels (DCVs)
In 2025, AMSA conducted 2,481 initial DCV inspections (up from 2,275 in 2024), including 122 inspections with operational monitoring of drills or procedures to assess safety management systems. Detentions occurred in 4.07% of inspections (up from 3.34%), while deficiencies per inspection fell to 3.38 (down from 3.69), indicating improved overall compliance. However, detainable deficiencies rose significantly from 140 to 198 (+41.4%), pointing to ongoing serious safety issues, particularly in structural conditions and Safety Management System (SMS) implementation.
Flag state control (FSC)
For Australian-flagged vessels, FSC inspections increased to 80 in 2025 (from 69 in 2024). The detention rate decreased slightly to 3.75% (from 4.35%), reflecting stable performance. However, deficiencies per inspection rose to 5.44 (from 4.96), largely due to a stronger focus on higher-risk ships that typically present more issues. One Australian vessel was detained during overseas port State inspections, highlighting continued gaps in ISM Code compliance, although one deficiency was outside AMSA’s remit (ship security).
source : safety4sea
Featured Post
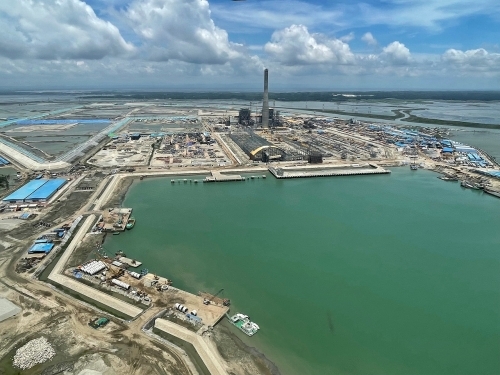 বড় জাহাজ মেরামতে মাতারবাড়ীতে ১ বিলিয়ন ডলারের প্রকল্প
 মাতারবাড়ীতে প্রায় ১ বিলিয়ন মার্কিন ডলার ব্যয়ে পরিবেশবান্ধব ডকইয়ার্ড ও জাহাজ নির্মাণ কেন্দ্র স্থাপনের উদ্যোগে নীতিগত অনুমোদন দিয়েছে নৌপরিবহন মন্ত্রণালয়। এখন প্রকল্পটির কারিগরি ও আর্থিক মূল্যায়নের জন্য প্রস্তাবটি সরকারি-বেসরকারি অংশীদারত্ব (পিপিপি) কর্তৃপক্ষের কাছে পাঠানো হয়েছে। সম্পূর্ণ বেসরকারি অর্থায়নে সরকারি জমির মালিকানা অক্ষুণ্ন রেখে প্রকল্পটি বাস্তবায়নের পরিকল্পনা রয়েছে। বন্দর কর্তৃপক্ষ জানায়, […]
 Industry on alert over scam messages offering ships “safe passage” on Hormuz
 Credit: Shutterstock Fraudulent messages offering safe passage through the Strait of Hormuz in exchange for cryptocurrency have been circulated to shipping companies with vessels stranded west of the waterway, according to MARISKS. In an alert issued on 20 April, MARISKS cautioned that unknown actors posing as Iranian authorities had contacted […]


JOB SITES
CONTENTS
LINKS
Happy New Year

Découvrez les avantages de MadCasino
Dans le monde des casinos en ligne, MadCasino se distingue par ses offres attrayantes et ses services de qualité. Que vous soyez un joueur débutant ou un parieur aguerri, vous trouverez ici une variété de jeux qui sauront satisfaire toutes vos envies. Les machines à sous, les jeux de table et les options de paris en direct sont tous disponibles pour vous offrir une expérience de jeu inégalée. De plus, le casino propose régulièrement des bonus qui permettent d'augmenter vos chances de gagner, vous offrant ainsi une excellente opportunité de maximiser vos gains.
En matière de sécurité, MadCasino est un nom de confiance. Il est entièrement licencié et régulé, ce qui garantit un environnement de jeu sûr et équitable. Les joueurs peuvent se concentrer sur leur expérience de jeu sans se soucier des problèmes de sécurité. Les transactions financières sont également sécurisées grâce à des technologies de pointe.
Les jeux proposés par MadCasino sont issus des développeurs les plus réputés de l'industrie, vous assurant des graphismes époustouflants et des mécaniques de jeu innovantes. Les joueurs peuvent également profiter d'une expérience de jeu en direct qui simule l'atmosphère d'un casino terrestre, tout en restant dans le confort de leur maison.
Enfin, la plateforme de MadCasino est optimisée pour les appareils mobiles, permettant aux joueurs de parier à tout moment et de n'importe où. Que vous soyez sur votre smartphone ou votre tablette, l'accès à vos jeux préférés n'a jamais été aussi simple. Ne manquez pas l'opportunité de découvrir ce casino exceptionnel.
Les offres de Cresus Casino
Cresus Casino est un autre acteur majeur dans le domaine des jeux en ligne, offrant des promotions généreuses et une vaste sélection de jeux. Les joueurs peuvent profiter d'une expérience de jeu enrichissante grâce aux nombreux bonus disponibles, qui sont conçus pour attirer tant les nouveaux utilisateurs que les joueurs réguliers. Ces avantages permettent non seulement de prolonger votre temps de jeu, mais aussi d'augmenter vos chances de gains conséquents.
Le casino se distingue également par sa ludothèque impressionnante, comprenant une sélection variée de machines à sous, de jeux de table et de jeux en direct. Les clients peuvent choisir parmi des titres populaires et appréciés, ainsi que des nouveautés qui enrichissent constamment l'offre. L'interface utilisateur est conviviale, rendant la navigation sur la plateforme fluide et agréable.
En termes de sécurité, Cresus Casino assure à ses joueurs un environnement de jeu fiable. La plateforme utilise des protocoles de sécurité avancés pour protéger les données personnelles et financières des utilisateurs. Cela permet aux joueurs de se sentir en sécurité tout en jouant à leurs jeux préférés.
Avec un service client réactif et professionnel, Cresus Casino s'assure que toutes vos questions et préoccupations sont traitées rapidement. Que ce soit pour des questions concernant les bonus, les retraits ou les jeux, vous bénéficierez d'une assistance rapide et efficace.
Explorez Nine Casino et ses avantages
Dans l'univers des casinos en ligne, Nine Casino a su se faire une place de choix grâce à son approche innovante et à ses nombreux avantages pour les joueurs. Les utilisateurs peuvent s'attendre à une expérience de jeu enrichissante, avec des bonus attractifs qui sont régulièrement mis à jour. Ces offres sont une excellente façon de découvrir de nouveaux jeux tout en maximisant votre potentiel de gain.
La plateforme de Nine Casino est riche en options de jeux, allant des machines à sous aux jeux de table, en passant par le live casino. Chaque jeu est conçu pour offrir une expérience immersive grâce à des graphismes de haute qualité et des fonctionnalités innovantes. Les parieurs peuvent profiter de sessions de jeu captivantes, comme s'ils étaient dans un véritable casino.
La sécurité est une priorité pour Nine Casino, qui utilise des technologies de cryptage avancées pour protéger les informations de ses joueurs. Cela garantit un environnement de jeu sûr et fiable, permettant aux utilisateurs de se concentrer sur ce qu'ils aiment le plus : jouer.
Enfin, le service clientèle fourni par Nine Casino est exceptionnel, avec des agents disponibles pour répondre à toutes vos questions et résoudre vos problèmes. Vous pourrez ainsi jouer en toute tranquillité, sachant que votre satisfaction est au cœur de leurs préoccupations.
Profitez de l'expérience Lucky31
Lucky31 est un casino en ligne qui se distingue par son approche orientée vers le joueur, offrant une multitude d'options de jeux et des bonus généreux. Que vous soyez amateur de machines à sous ou passionné de jeux de table, vous trouverez une large sélection pour satisfaire toutes vos envies de jeu. Les promotions fréquentes permettent aux joueurs de prolonger leur expérience tout en augmentant leurs chances de gains.
La convivialité de la plateforme de Lucky31 est l'un de ses plus grands atouts. Les joueurs peuvent naviguer facilement entre les différents jeux, et l'interface est conçue pour être intuitive, quel que soit le niveau d'expérience de l'utilisateur. De plus, le casino est entièrement optimisé pour les appareils mobiles, ce qui permet de parier où que vous soyez.
En matière de sécurité, Lucky31 prend les préoccupations des joueurs très au sérieux. Le casino est agréé et régulé, garantissant un environnement de jeu équitable et sécurisé. Les joueurs peuvent ainsi se concentrer sur leur expérience de jeu sans se soucier des risques liés à la sécurité.
Pour ceux qui recherchent un support client efficace, Lucky31 offre un service réactif et professionnel. Que ce soit pour des questions sur les bonus, les jeux ou les paiements, vous aurez accès à une assistance de qualité, vous garantissant une expérience de jeu fluide et agréable.