search the site
Panama Canal transits plunge as larger ships are turned away
Panama Canal transits plunge as larger ships are turned away
Restrictions are having an increasing impact on Neopanamax transits
·Wednesday, December 13, 2023 Freight Waves

The official Panama Canal transit numbers for November are out — and they’re ugly. November could be the tip of the iceberg. Reservation slots are being slashed further this month and in January.
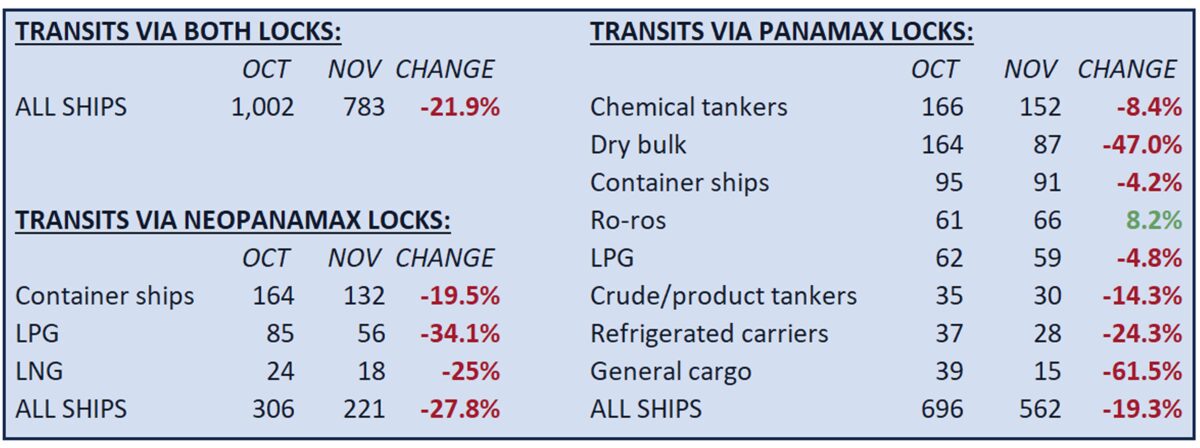
The total number of transits declined 22% in November versus October, according to just-released data from the Panama Canal Authority (ACP). And for the first time since the drought began, the numbers are not just falling at the older, smaller Panamax locks. They’re also declining sharply at the larger Neopanamax locks, which debuted in 2016.
The Neopanamax locks are a crucial conduit for high-capacity container vessels bringing goods from Asia to U.S. East and Gulf Coast ports, and for liquefied petroleum gas (LPG) and liquefied natural gas (LNG) carriers transporting exports from the U.S. Gulf to Asia.
Transits through the Neopanamax locks fell 28% in November versus October, while transits through the Panamax locks dropped by 19%.
Container ships, LPG ships and LNG ships were all hard-hit on the Neopanamax side. At the Panamax locks, dry bulk shipping was the biggest decliner, by far.
This time of year is the height of the export season for American farmers, when grain cargoes traditionally move via the Panama Canal from the U.S. Gulf to Asia.
These transits have gone off a cliff as grain-laden bulkers have shifted to the Suez Canal: 164 Panamax bulkers transited in October and just 87 in November — a 47% month-on-month collapse.

November was turning point for Neopanamax locks
The ACP also publishes monthly data on average daily transits by lock type. This data shows just how extreme the November drop-off was compared to prior months.
The shipping impact of Panama’s low water levels has been highly publicized since this summer. However, the drought’s effect on Neopanamax transits — and thus, on Asia-U.S. container shipping — only began last month.
Average daily transits through the Neopanamax locks were actually 4% higher during the first 10 months of 2023 versus the same period in 2022, prior to the drought. In October, average daily transits were up 7% year on year.
Then came November. There was an average of 7.37 transits per day through the Neopanamax locks, down 25% from 9.83 per day in November 2022.
In contrast, year-on-year declines at the Panamax locks began back in May. Between May and October, average daily transits through the Panamax locks fell 11% versus the same period in 2022.
But here too, November marked a major downturn. There were an average of 18.74 transits per day through the Panamax locks last month, a 29% plunge compared to November 2022.
Average wait time eases as ships divert from Panama
The ACP instituted severe restrictions on scheduled transits starting in early November. There were 10 daily reservation slots for Neopanamax transits at the beginning of last month. By Dec. 1, there were just six. On Jan. 1, the number of slots falls to five.
At the beginning of November, there were 22 daily reservation slots at the Panamax locks. By Dec. 1, there were 16. That will fall to 15 on Jan. 1 and 13 on Feb. 1.
The initial effect of the ACP cutting reservation slots was a surge in waiting time for vessels that arrived without reservations.
That effect is now changing. Ship operators appear to have learned their lesson. Rather than heading to the Panama Canal without a reservation, they’re choosing alternate routes and avoiding the risk, reducing both the queue and wait time.
There were only 23 ships in the queue without reservations on Wednesday. The total number of ships in the queue, including those with reservations, is down to 76, compared to a high of 163 on Aug. 9 and an average during normal periods of around 90.
Average wait time for ships without reservations surged throughout last month. On the southbound Atlantic-to-Pacific route, wait time has fallen back in December. On the northbound Pacific-to-Atlantic route, waiting time continued to escalate until Dec. 6, then retreated as well.
Average southbound wait time for ships without reservations peaked at 11.4 days on Nov. 29 — 5.4 times higher than on Nov. 2. Wait time was down to eight days on Wednesday, 30% off the high.
Average wait time for northbound ships without reservations peaked at 15.2 days on Dec. 6, also 5.4 times higher than at the beginning of November. It has since fallen 53% to seven days on Wednesday.


