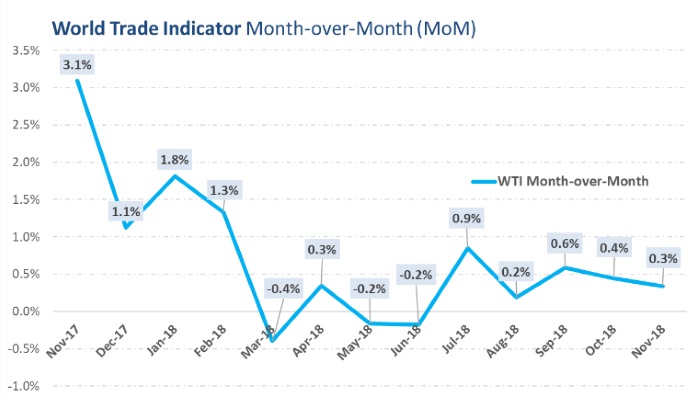
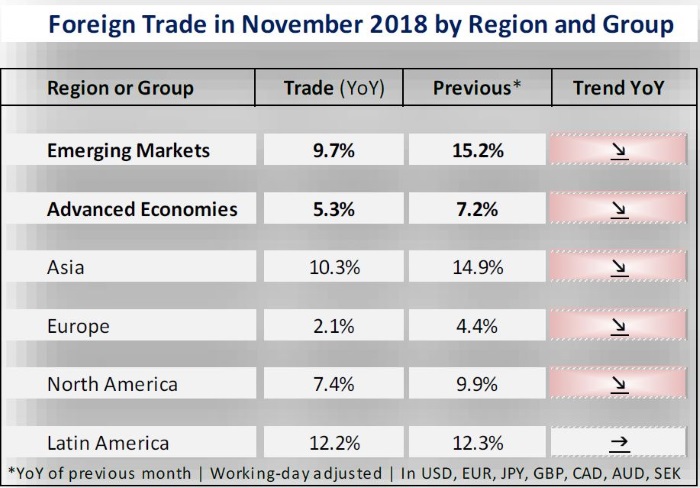
 World trade experienced a slight upswing in recent months and reached a new high in November. So far this year, international merchandise trade has risen by 10.6%. Emerging markets and North America are the main growth drivers. Despite new tariffs on exported products, China is benefiting from the strong U.S. economy. The nowcasts show we should expect this to continue also throughout December.
+0.3% Month-over-Month (MoM)
The gKNi World Trade Indicator powered by LogIndex AG, the data company of Kuehne + Nagel, stood at 143.7 at the end of November, up 0.3% on the previous month and 6.4% from last year. The World Trade Indicator not only reached a new record high, but this was also the fifth sequential increase since June.

World Trade Indicator at the end of November 2018, seasonally and
working-day adjusted (SA), in USD: 143.7 points, Jan 2010 = 100
points. Export and import data from World Trade Organization (WTO)
at the end of September 2018, in USD: 148.3 (+4.1% YoY); Jan 2010 =
100 points. The monthly merchandise values according to WTO are
not seasonally or working-day adjusted (NSA), exports are valued
FOB and imports CIF.
Strong domestic demand
The main driver is strong domestic demand in the United States but also in China. For China, we expect import growth of 21.2% YoY in the second half of the year (first half: +20.2% YoY in USD). Export estimates are at 10.6% (first half: +14.3%). Imports also overtake exports in the United States at an annual rate of 9.1% and 7.1% respectively (first half: 8.1% versus 8.6%). The analyses show a particularly robust demand for consumer goods: In November, imports of furniture were over 10% higher than in the previous year. Even vehicles imports tend to be higher as do electronic products and capital goods. So far, the figures point to an extraordinarily dynamic fourth quarter.
Sea freight: Up 2.9% year-to-date
In ocean freight, measured by the live throughput of ports, the unit volume declined slightly in November (-0.3% MoM), after a jump in October (+1.0%). Sea freight has still risen by +2.9% since the beginning of the year. The cargo and container throughput in U.S. ports increased by +4.5% year-to-date and in Chinese ports by +2.6% year-to-date (compared with the same period in 2017).

This chart shows the Month-over-3-Month changes based
on gKNi Air Freight Indicator covering 75% of air cargo.
Australia and Brazil top
Australia and Brazil recorded the highest annual rates in exports. India, the Netherlands, Taiwan and Spain are at the bottom. Exports of Taiwan and India are also expected to be negative in December.

Heat map with the latest trends, derived from LogIndex forecasts and official data of exports and
imports, in USD, EUR, JPY, GBP, AUD, CAD, AND SEK (in USD: USA, Latin America, Africa, Eastern
Europe, Baltic, Balkan, India, China, Indonesia, Vietnam, a.o.).
Trade balance: Worsening of the situation in UK and US
The trends in trade balances (exports minus imports) based on the latest forecasts signal a worsening of existing deficits in Canada, France, United Kingdom, Sweden and the United States.

gKNi World Trade Indicator (WTI, YoY) compared to the Composite Leading
Indicators CLI of OECD (scale on the left-hand side). The CLI signal easing
growth momentum in the OECD area and euro area as a whole. The
indicators continue to anticipate easing growth momentum in the United
Kingdom, France and Italy, with similar signs now emerging in Germany.
Source: Logindex AG, The data company of Kuehne + Nagel Group


